
Introduction.
- This post builds up on the knowledge that we have gained in our previous article. If you have not read through the previous article (The Machine Learning Process Explained), and would like to do so, kindly navigate to this hyperlink.
- This article will provide us with a deeper understanding of the ways of Artificial Intelligence; specifically Machine Learning and way in which a machines attempts to “learn” presented with large quantities of data.

A Simple Machine Learning Example.
- To increase your level of relatability, a very interesting point I should mention before we look at our example is: Thinking back at your days of school. Do you remember your first mathematics class in which you were introduced to drawing a line of best fit across the data points scattered on a scatter plot? This line of best fit required that the number of data points located above the line was equal to the number of data points below the line.
- Believe it or not- What your mathematics teacher did not tell you was that the actions you were performing during that very moment were a simple form or type of Machine Learning technique. It is called Linear Regression. Now, let us move on to our example, keeping in mind the teachings learned in school.

1. The Data Preparation Phase.
- Lets say we have a simple dataset that comprises two features- Crime Rate and House Price- Our data is in good condition and needs no further actions to be taken for preparation.
- We would like to predict the value of House Price therefore making it our Target Vector and dependent variable. As we know, the dependent variable will be found on the Y-Axis.
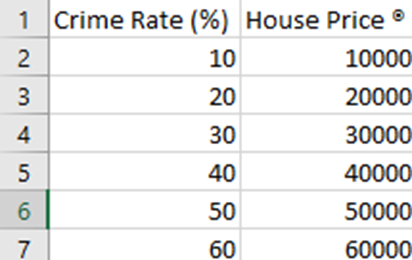
- We will use the remaining features, namely, Crime Rate to make the predictions, therefore making it our Features Matrix, and independent variable, which will place it along the X-Axis.
- To gain further insight into our Data, let us plot a visualization of the data, as seen below.

- As can be seen from the visualization, we have a scatter plot showing us the position of the data points relative to each other.
- Looking at the graph and data points, one can anticipate that there is a direct relationship between Crime Rate and House Price. Because as X increases, so does Y.
2. The Algorithm Selection Phase.
- In our particular problem, we wish to predict House Prices. The House Price feature takes the form of Numerical Data, i.e., Quantitative values. Scroll up a bit, and look at the data, focusing on the House Price (R) column. Quantitative or Numerical Data will tell us the Amount, Quantity, or Measurement of something.
- Notice, these values are continuous- There is no fixed, or predefined range within with the values can belong. That is why they are called Continuous. Now to predict values of this nature, we require a method or algorithm that will be able to learn the trend in the dataset once-off, and will allow us to use the model for making future predictions pertaining to House Prices.
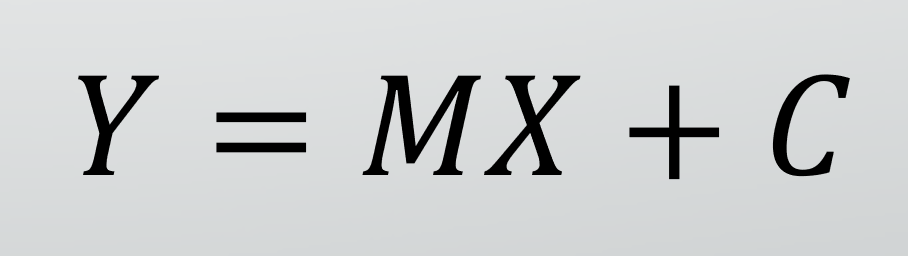
- The method/algorithm we would select will be The Straight Line Graph- or Linear Regression. It has the following formula:
3. The Model Compilation Phase.
- Now that we have effectively selected the algorithm to utilize, we may proceed to expose the Algorithm to the data, in order to obtain a successful powerful model.
- When an algorithm is applied to data, the process of forming the model involves mathematics and statistics. The model needs to carefully choose and select the best coefficients to make use of in the formulae.
- One must understand that the model’s digital compilation and selection of coefficients that occurs during the Machine Learning process, tends to happen in backend processes that cannot be seen by the human being. However, when brought forward into the light, each of these intrinsic processes can be expressed mathematically in the form of formulae and equations, and one is able to see exactly how the model has reached those conclusions.
Where:
- Y is the value for the Y variable, in our case House Price.
- X is the value for the X variable, in our case Crime Rate.
- M is the gradient of the graph.
- C is the y-value at the point the gradient intercepts the y-axis. It is the y-intercept.
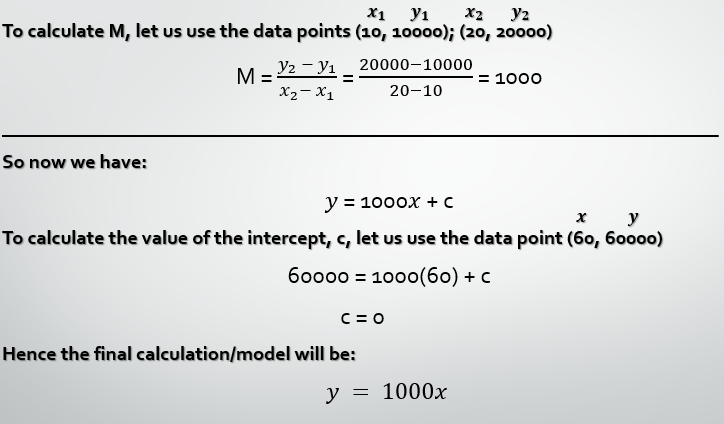
Upon doing the mathematics manually, one will find:
- M = (y_2 – y_1)/(x_2- x_1 ) (two data points need to be substituted into the respective placeholders).
- To calculate the value of C, one needs to make it the subject of the formula by substituting a third data point into the equation.
4. The Evaluation/Prediction Phase.
- Now that we have successfully compiled a model, we may proceed to evaluate its predictive power, and use it to make predictions for future scenarios.
- Suppose we have a community in which the Crime Rate is 70(%). We wish to know the approximate Price of a House based on this figure. With Machine Learning, making a future prediction becomes simple- We simply make use of the model.
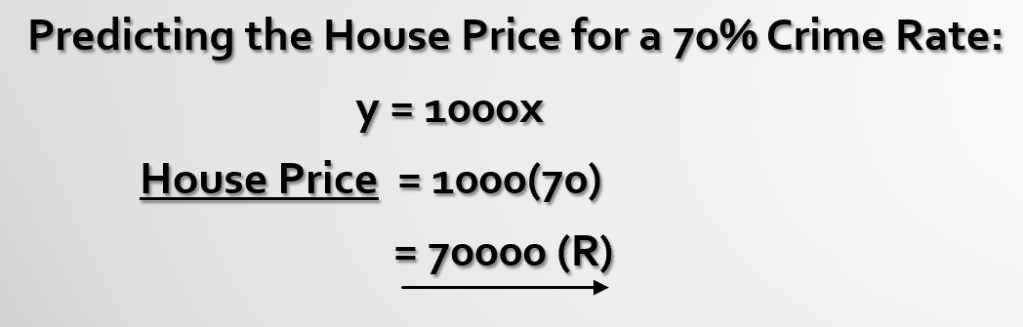
- Given the fact that I have used a simple example scenario to work with, one is able to see that the models prediction is 100% accurate, if the data follows a continuous trend as we have seen in the table and scatter plot. We may confidently say that a Crime Rate of 70% will cause a House Price to be R70000. Hence, we can assume that our model has achieved 100% accuracy in it’s predictions.
- The reason as to why I call this stage Evaluation/Prediction, is because I believe that it is good practice to evaluate model performance before attempting to make a prediction. This gives us insight into our models margin of error- thereby notifying us of: up to what level or degree our model could be incorrect in it’s prediction.
Conclusion.
- In this tutorial we have gained knowledge into the methodology, terms, and nature of Machine Learning in the real world.
- We have successfully learnt about the backend processes that occur in an Artificial Intelligence.
- I hope that you found this article interesting.
- Thank you for your time.